Raw data
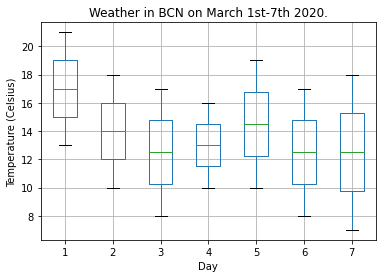
The Dataset consists of temperature data from Barcelona (Spain). The data
goes from March 1st (1) to March 7th (7) in 2020.
The events DataFrame extends the Dataset to add meaning to it. It
describes some notable weather conditions during these dates.
This is how we declare it:
import numpy as np
import pandas as pd
import xarray as xr
import xarray_events


tmin_values = [13, 10, 8, 10, 10, 8, 7]

tmax_values = [21, 18, 17, 16, 19, 17, 18]

ds = xr.Dataset(
    data_vars={
        'tmin': ('time', tmin_values),
        'tmax': ('time', tmax_values),
    },
    coords={'time': np.arange(1, 8)},
    attrs={'temperature_system': 'celsius', 'location': 'BCN'}
)

events = pd.DataFrame(
    {
        'event_type': ['light-rain-shower', 'patchy-rain-possible'],
        'initial_timestamp': [1, 4],
        'final_timestamp': [3, 5]
    }
)
We can visualize the Dataset we’re working with.
ax = ds.to_dataframe().T.boxplot()
ax.set_xlabel("Day")
ax.set_ylabel("Temperature (Celsius)")
ax.set_title("Weather in BCN on March 1st-7th 2020.")
Text(0.5, 1.0, 'Weather in BCN on March 1st-7th 2020.')
In order to use it, let’s do some basic setup.
mapping = {'time': ('initial_timestamp', 'final_timestamp')}

ds = ds.events.load(events, mapping)
This is a very small dataset but still large enough to let us illustrate some
interesting applications of xarray-events.